
In this tutorial, we will explain how to install ELK Stack on Ubuntu 24.04 server with Nginx web server and Let's Encrypt Certbot SSL certification.
The ELK Stack, consisting of Elasticsearch, Logstash, and Kibana, is a powerful set of tools used for searching, analyzing, and visualizing log data in real time. This open-source stack is widely used for managing and analyzing large volumes of log data, making it an essential component for monitoring and troubleshooting modern software applications and IT infrastructure.
Prerequisites
- An Ubuntu 24.04 installed dedicated server
- A user with sudo privileges
- At least 4GB of RAM (more recommended for larger datasets)
- Create an A record pointing to your server's IP address. For example: kibana.example.com
Step 1: Update Your System
Before starting, ensure your system is up to date.
sudo apt update
sudo apt upgrade -y
Step 2: Install Java
Elasticsearch requires Java. You can install OpenJDK, which is a free and open-source implementation of the Java Platform.
sudo apt install openjdk-17-jdk -y
Verify the installation:
java -version
Step 3: Install Elasticsearch
Add the Elasticsearch GPG Key:
wget -qO - https://artifacts.elastic.co/GPG-KEY-elasticsearch | sudo apt-key add -
Add the Elasticsearch Repository:
sudo sh -c 'echo "deb https://artifacts.elastic.co/packages/7.x/apt stable main" > /etc/apt/sources.list.d/elastic-7.x.list'
Now, let's install the Elasticsearch:
sudo apt update
sudo apt install elasticsearch -y
Start and Enable Elasticsearch:
sudo systemctl start elasticsearch
sudo systemctl enable elasticsearch
Verify Elasticsearch:
curl -X GET "localhost:9200/"
Output:
{
  "name" : "elk",
  "cluster_name" : "elasticsearch",
  "cluster_uuid" : "yMKeohL1SnafmH9eiMXPAA",
  "version" : {
    "number" : "7.17.21",
    "build_flavor" : "default",
    "build_type" : "deb",
    "build_hash" : "d38e4b028f4a9784bb74de339ac1b877e2dbea6f",
    "build_date" : "2024-04-26T04:36:26.745220156Z",
    "build_snapshot" : false,
    "lucene_version" : "8.11.3",
    "minimum_wire_compatibility_version" : "6.8.0",
    "minimum_index_compatibility_version" : "6.0.0-beta1"
  },
  "tagline" : "You Know, for Search"
}
Step 4: Install Logstash
Execute the following command to install Logstash:
sudo apt install logstash -y
Start and Enable Logstash:
sudo systemctl start logstash
sudo systemctl enable logstash
Step 5: Configure Elasticsearch
For authentication, we need to enable xpack security. Edit the Elasticsearch configuration file:
sudo nano /etc/elasticsearch/elasticsearch.yml
Add the following security settings:
xpack.security.enabled: true
xpack.security.authc.api_key.enabled: true
Restart Elasticsearch:
sudo systemctl restart elasticsearch
Set passwords for built-in users:
Run the following command to set passwords for built-in users (including the elastic user):
sudo /usr/share/elasticsearch/bin/elasticsearch-setup-passwords interactive
This will prompt you to enter passwords for the following users:
Initiating the setup of passwords for reserved users elastic,apm_system,kibana,kibana_system,logstash_system,beats_system,remote_monitoring_user.
You will be prompted to enter passwords as the process progresses.
Please confirm that you would like to continue [y/N]
Follow the prompts and set the passwords accordingly.
Step 6: Install Kibana
Execute the following command to install Kibana:
sudo apt install kibana -y
Start and Enable Kibana:
sudo systemctl start kibana
sudo systemctl enable kibana
Now, open the Kibana configuration file:
sudo nano /etc/kibana/kibana.yml
Uncomment and set the following lines or copy and past at the end of the file:
Note: Replace kibana.example.com with your domain name. Add xpack in the file. Also replace elasticsearch.password with your passwoord.
server.port: 5601
server.host: "0.0.0.0"
server.name: "kibana.example.com"
elasticsearch.hosts: ["http://localhost:9200"]
elasticsearch.username: "kibana_system"
elasticsearch.password: "password@123"

# Add following lines in the file:
xpack.security.enabled: true
Save and exit.
To reflect the changes we need to restart Kibana:
sudo systemctl restart kibana
Step 7: Configure Logstash to Collect and Parse Logs
Create a configuration file for Logstash:
sudo nano /etc/logstash/conf.d/logstash.conf
Here’s an example configuration that reads syslog messages:
input {
  file {
    path => "/var/log/syslog"
    start_position => "beginning"
  }
}

filter {
  grok {
    match => { "message" => "%{SYSLOGTIMESTAMP:timestamp} %{SYSLOGHOST:hostname} %{DATA:program} (?:\[%{POSINT:pid}\])? %{GREEDYDATA:message}" }
  }
  date {
    match => [ "timestamp", "MMM  d HH:mm:ss", "MMM dd HH:mm:ss" ]
    timezone => "UTC"
  }
}

output {
  elasticsearch {
    hosts => ["https://your_domain:9200"]
    index => "syslog-%{+YYYY.MM.dd}"
    ssl => true
    cacert => "/etc/letsencrypt/live/your_domain/fullchain.pem"
    user => "logstash_system"
    password => "your_logstash_system_password"
  }
}
Note: Replace your_logstash_system_password with the password you have set during the step 5.
Save and exit.
Restart Logstash to apply the configuration:
sudo systemctl restart logstash
Step 8: Install and Configure Nginx
Now, let's install the Nginx as a proxy server. So that, we can access the Elasticsearch from our domain name.
sudo apt install nginx -y
Create a new Nginx configuration file for Kibana:
sudo nano /etc/nginx/sites-available/kibana.example.com
Note: Replace kibana.example.com with your domain name.
Add the following configuration to the file:
Replace kibana.example.com with your actual domain name.
server {
    listen 80;
    server_name kibana.example.com;

    location / {
        proxy_pass http://localhost:5601;
        proxy_set_header Host $host;
        proxy_set_header X-Real-IP $remote_addr;
        proxy_set_header X-Forwarded-For $proxy_add_x_forwarded_for;
        proxy_set_header X-Forwarded-Proto $scheme;
    }
}
Enable the configuration:
sudo ln -s /etc/nginx/sites-available/kibana.example.com /etc/nginx/sites-enabled/
Test Nginx configuration and reload:
sudo nginx -t
sudo systemctl reload nginx
Step 9: Configure Firewall (If applicable):
If you have enabled UFW firewall, follow this step and add HTTP and HTTPS ports:
ufw allow 80/tcp
ufw allow 443/tcp
ufw reload
Step 10: Obtain SSL Certificates with Let's Encrypt Certbot
First, install Certbot using following command:
sudo apt install certbot python3-certbot-nginx -y
Obtain and install SSL certificate:
Replace kibana.example.com with your actual domain name.
sudo certbot --nginx -d kibana.example.com
Follow the prompts to complete the SSL certificate installation.
Certbot will automatically configure SSL settings for Nginx. Verify the configuration file /etc/nginx/sites-available/kibana.example.com to ensure it includes SSL settings:
Step 11: Test the Setup
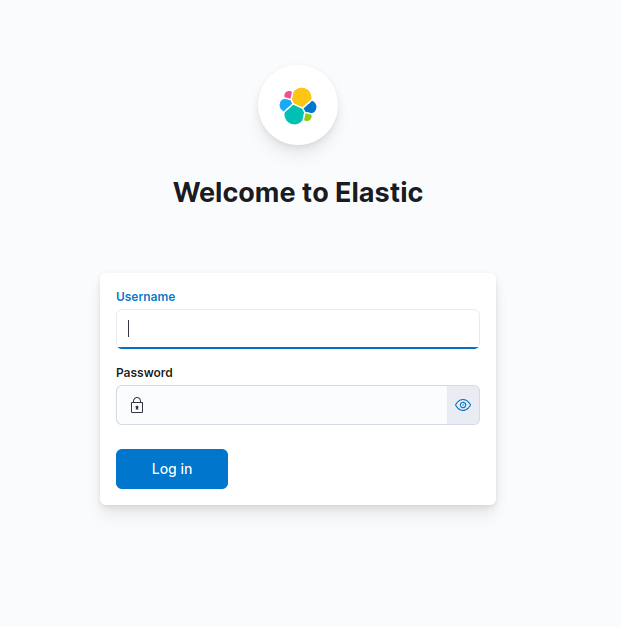
Finally, access Kibana with your domain name:
Open your web browser and navigate to https://kibana.example.com. You should see the Kibana login screen.
Conclusion
We have successfully seen how to install ELK Stack on Ubuntu 24.04 server. You can now ingest, analyze, and visualize your log data with Elasticsearch, Logstash, and Kibana. This setup can be expanded and customized to suit your specific needs. We have configured Kibana to be publicly accessible on a custom domain secured with SSL using Let's Encrypt.